The Grouparoo Blog
A necessary practice and skill to building a successful product is having accurate, accessible, and actionable data. I’ve had the privilege to work at some great companies that are extremely data-focused, and I’ve learned from some of the best along the way.
Quantitative user data
At Zynga, we had millions of daily active users, where we tracked every click, action, and session across all of our games and apps. This data allowed us to conduct tons of multi-variate tests, often getting to statistical significance in a matter of hours. Having that wealth of data was both a blessing and a curse. From my experience, I was able to hone my skills at defining hypotheses, tests, analyzing the results quickly, and making decisions on features with confidence. The downside to this approach was that it became harder to push back on doing tests that would improve short-term metrics (revenue, feature usage), but harm long-term metrics (retention, Net Promoter Score (NPS), Customer Satisfaction (CSAT)).
Qualitative user data
During my time at TaskRabbit and Stripe, I really cut my teeth at conducting customer discovery and user research interviews. TaskRabbit and Stripe are both very different companies from Zynga, in that Zynga’s games are entertainment, while TaskRabbit’s and Stripe’s products are tools, providing utility to a person or business. While there are many product development principles that are applicable across many types of products, users of products that are tools often have a much clearer picture about the goals they’re trying to accomplish or the challenges they’re facing. Because of that difference, talking to users is often one of the best ways to learn very quickly where your product isn’t meeting expectations. I spent a ton of time working with my product, design, and research partners to define research goals, recruit users, conduct the interviews, and synthesize findings.
How open source metrics are different
While we’re still in the early days at Grouparoo, I quickly realized that because our product is open source, I didn’t have as many of the tools at my disposal as I did in my previous roles. Unlike SaaS products or even installed software where you have direct access to user and product usage data through SQL queries, we have to piece together metrics from a few different places. It's taken me a bit of time to adjust to this new landscape, so I thought I'd share our approach right now.
Discovery metrics
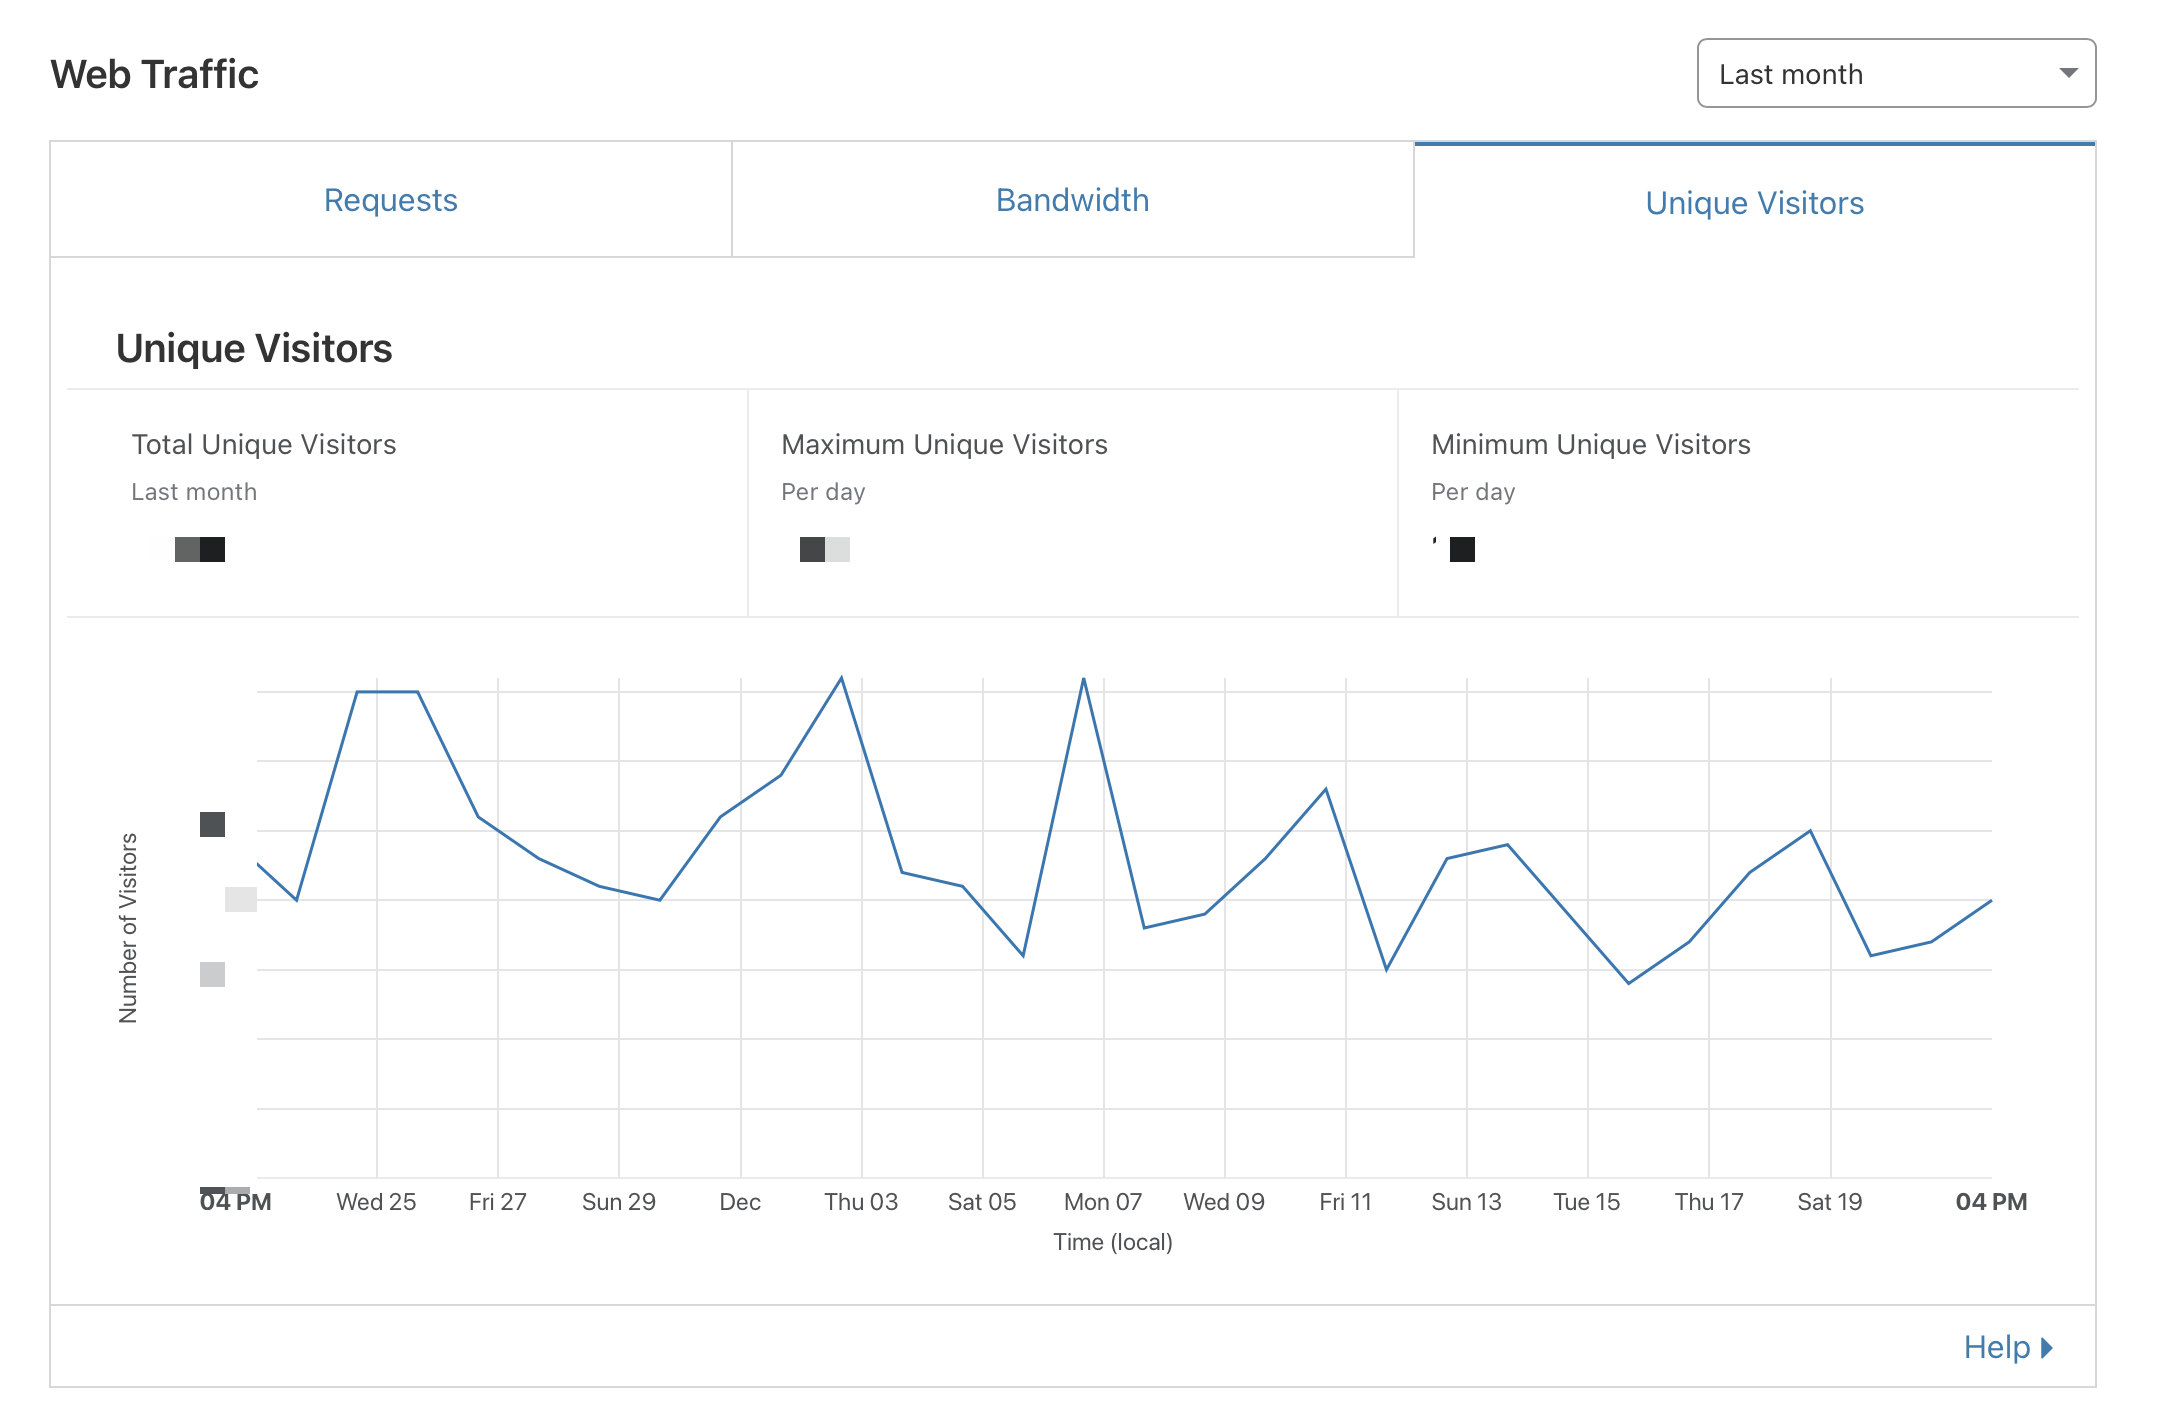
We can monitor discovery and adoption in a few different places. We have Cloudflare on our www site, which gives us a rough sense for site visitors and traffic.
Github has a number of metrics as well that are useful for project owners and admins to track the performance of their project. If you go to the Insights page on your Github project and click the traffic tab, you can see data about page views, unique visitors, referrers, and which pages are viewed the most.
Adoption and Usage metrics
We measure adoption and usage in a few different places.
Grouparoo is built with Node.js, so we’ve published our product on npm. We can see metrics regarding how often our packages have been downloaded there.
On Github, on the same Traffic tab on a project, you can see how many times your repo has been cloned and the unique number of users who have downloaded your project.
We’ve also included optional telemetry in Grouparoo that allows us to gather anonymous usage information from people who are using Grouparoo. All of this data is entirely anonymous, but it helps us understand details about our users’ Grouparoo environments like their operating systems, how many workers you have running, the number of Sources and Destinations they might have, etc.
Qualitative research
The tools I mentioned above are mostly for tracking quantitative metrics. For qualitative research, it’s also a bit different compared to my past companies. Before at Stripe or TaskRabbit, I could write some SQL queries to identify customers to speak with. Now, it’s harder to know exactly who is using our product unless they’ve actively signed up for our email list or contacted us via Github or email. That said, we’ve been lucky to have engaged users who are happy to jump on a call to share their thoughts on why they sought out a tool such as ours.
Conclusion
We’re still learning as we go, and we’re always experimenting with new tools that might help us better understand and connect with our users. A number of products that help measure community engagement such as Orbit and Commsor are exciting entrants into the space. I’d love to hear how you all are measuring your projects and engaging with your users and communities.


Tagged in Product
See all of Andy Jih's posts.
Andy is the COO and co-founder of Grouparoo, an open source data framework that easily connects your data to business tools. Andy loves building products that help people.
Learn more about Andy @ https://www.linkedin.com/in/andyjih


Get Started with Grouparoo
Start syncing your data with Grouparoo Cloud
Start Free TrialOr download and try our open source Community edition.