The Grouparoo Blog
The steps utilizing
grouparoo generate will not be replicable as the command will be fully deprecated in v0.8.1What is Operational Analytics?
Operational analytics is the process of creating data pipelines and datasets to support business teams such as sales, marketing, and customer support. Data analysts and data engineers are responsible for building and maintaining data infrastructure to support many different teams at companies.
What did you do before Operational Analytics and Reverse ETL existed?
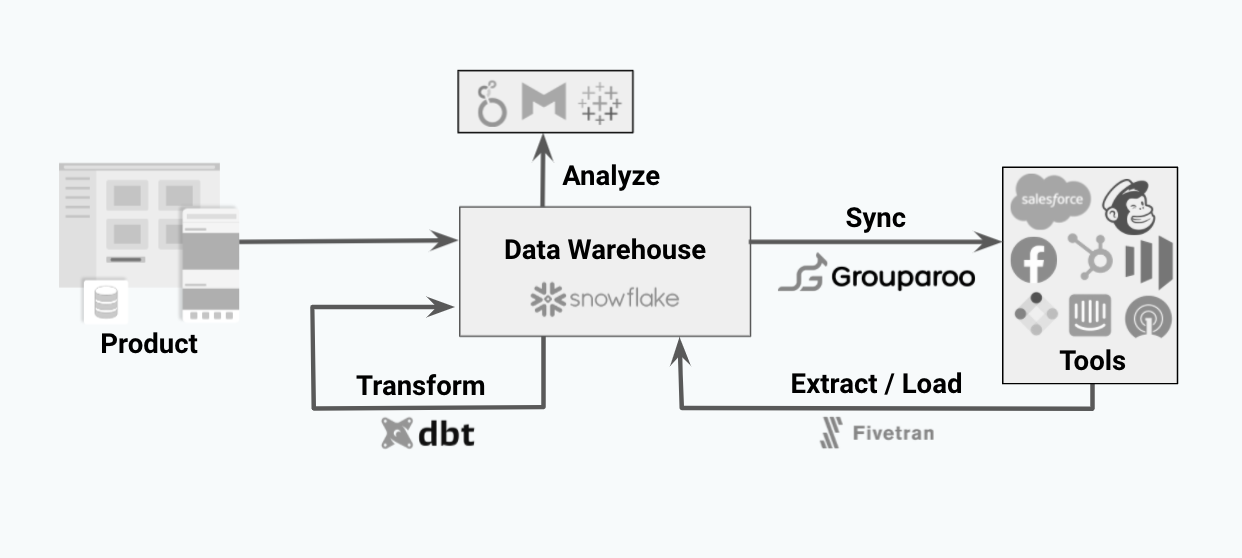
The Modern Data Stack is a recent development in the data engineering space. The core enabler of the Modern Data Stack is that data warehouse technologies such as Snowflake, BigQuery, and Redshift have gotten fast enough and cheap enough to be considered the source of truth for many businesses. With the data warehouse functioning as a business’s or organization’s source of truth, different data tools have emerged to support and power each step in this modern data stack.
Up until recently, the primary goal for data teams was to get data into the warehouse. Tools like Fivetran, Airbyte, Meltano, and others are focused on getting data into a data warehouse, and tools like dbt are focused on transforming that data into understandable and uniform data for teams to analyze. Data teams would then point tools like Metabase, Looker, or Tableau at these datasets and teams could do analysis and business intelligence. You can read more about the Modern Data Stack here.
The data journey and stack usually ended here. Marketers, sales teams, and customer service teams were then able to explore their data warehouse and do their own analysis without needing to ask a data analyst or engineer. Giving these business teams the ability to understand their data without needing to bother another person was a step-function change and improvement for many organizations.
That said, these teams were still stuck; they had this data in their analytics and Business Intelligence (BI) tools, but to make use of this data, they needed to ask an engineer to build an integration with the marketing, sales, or customer support tools they’re using. Often engineers aren’t super excited to build these kinds of integrations. Product engineers don’t want to do it because these tools aren’t part of the core product. Data engineers also aren’t super keen to build these integrations because each tool’s APIs behaves differently, and creating a fully automated system that syncs across all of these tools becomes very unwieldy very quickly. And worst of all, let’s say an engineer builds this integration to pipe data from a data warehouse into an email marketing tool. They are now responsible for every new data field that a marketer or customer support agent wants in their email tool.
If these teams aren’t able to get support from an engineer, then they usually resort to manual processes to get data out of tools like Metabase or Looker using CSVs or google sheets and then importing them into their support (Zendesk, Intercom), email marketing (Marketo, HubSpot), or sales CRMs (Salesforce).
Since so many other parts of the data stack are about creating leverage and efficiency, this last step in the data journey is where Reverse ETL comes in, making Operational Analytics automated, testable, and resilient. Reverse ETL tools come with pre-built integrations to the various business tools your team uses, so the engineering team doesn’t have to build integrations with every single CRM or email tool.

One example of data progression:
We’ll use an example use case to show how that data progression has changed over the years. Let’s say a marketer wants to be able to create a drip campaign to target churned customers who haven’t made a purchase in the last six months. That should be a pretty simple list to generate, but it’s been woefully manual, requiring many different hands to be involved historically.
Progression of requests from business teams to data teams:
- Marketer asks a data analyst or engineer to generate a list. The analyst or engineer might have time to create this customer list, but this list is usually a CSV or spreadsheet. The minute that list is generated, it’s immediately out of date because that customer data is changing. The marketer then takes this CSV list and uploads it into their email marketing tool of choice, such as Marketo or Mailchimp. They probably name it something like ‘6month-churn-customer-list-jan-2018’, and before you know it, they’ll have hundreds of customer lists in their email tool that are nearly impossible to keep track of.
- In the last few years, various analytics tools like Looker, Metabase, or Tableau have made it easier for non-data teams to analyze and observe their own data in Looker. This change was great-- now, instead of having to ask a data analyst to pull a report, the marketer could explore the data in Looker themselves to see how many users are in the churned customer segment. Unfortunately at this point, the marketer is stuck in the same spot again. They still need to export this data as a CSV or spreadsheet, upload it manually into their email tool, and remember to do this every so often.
- The most recent progression with the advent of Reverse ETL tools that power Operational Analytics, is being able to connect the data warehouse directly into this email marketing tool.
Operational analytics - how it fits into the modern data stack
To make Operational Analytics truly automated, you want a Reverse ETL tool such as Grouparoo. Reverse ETL tools take data from your data warehouse and syncs that data directly into all of the business tools that user-facing teams use.
Nearly every piece in this process above has been owned by Data and Analytics teams. That said, before the advent of Reverse ETL tools, the last step of syncing data into business tools has been very inconsistent. An engineering team might prioritize syncing data into Salesforce or Mailchimp, but often teams are pulling one-off customer lists and uploading them into their tools. This practice leads to a very dangerous scenario where different teams are defining data inconsistently.
The goal with automating your operational data analytics and Reverse ETL process is to have a data engineer or analytics engineers own the definitions of what gets synced. Developer-focused operations analytics tools can fit directly into an engineer team’s workflow with CI/CD, git workflows, and testing.
Operational Analytics at work: Triaging Customer Support tickets based on product usage
You can imagine just about any customer-facing team’s campaigns or projects being faster and more effective with an operational analytics engine or Reverse ETL tool behind the effort. Here is a deep-dive example of how Operational Analytics drives growth.
A common practice for customer support teams is to triage support tickets as they show up. Let’s say a customer support team wants to prioritize customer support emails from existing users who have at least made a purchase, so they can address more timely issues as they relate to shipping or otherwise.
Scenario 1: No integration between data warehouse and customer support tool (Zendesk)
In this first scenario, the customer support team is in a world of hurt. As emails come in from customers, there’s no easy way to prioritize these emails and contacts. What likely happens then is that the customer support team is working through the queue, first in, first out. If a customer sent an email asking to change their shipping address, it’s possible for that email to be missed before the order has already been shipped. On top of that, the agent has to take the email address from Zendesk and paste it into an internal admin tool (if one exists) to find the customer order and make the change.
Scenario 2: Manual uploads of customer list into customer support tool (Zendesk)
This scenario is slightly better, but not by much. Let’s say the customer support team is regularly exporting customer lists from Looker or the data warehouse with a list of customers, how much they’ve spent as a customer, and the date of their most recent purchase. This helps the customer support team to triage tickets as they come in, but the data is only as recent as when the customer list was generated in Looker. This workflow is woefully manual as well-- it’s possible for the person who is uploading the list to make a mistake. CSVs also often have a row or size maximum, so if you’re working with a medium-to-large dataset, this approach breaks very quickly.
Scenario 3: Operational Analytics in practice, Reverse ETL tool pushing data automatically into Zendesk
The dream! If you have a Reverse ETL tool such as Grouparoo in place, then the most up-to-date customer usage data is streaming into Zendesk on a regular basis. The data engineering team has confidence that the correct data fields are being synced into Zendesk in a timely fashion. The customer support team is now able to create automated triage logic based on the customer data as the emails flow in. A high-value customer just sent an email? Great, their email automatically gets placed into the high-priority queue for a faster response. With Reverse ETL in place, operational analytics use cases become faster and easier for teams.
What does having a Reverse ETL tool in place look like?
Once you have a Reverse ETL picked out and implemented, life gets easier for everyone involved. With an engineering-focused tool in place such as Grouparoo, data engineers and analytics engineers are able to control the flow of data from their data warehouse into various customer tools using the developer workflow they’re already used to. Grouparoo generates configuration files that can be managed directly in your git workflows. You can then write and run automated tests to ensure that these data definitions are stable and steady. You can then easily deploy Grouparoo with your standard CI/CD workflows.
Now when stakeholders ask for a new data field to be sent to the email marketing or sales CRMs, the data engineer can quickly and easily create the definition for that data field that can then be synced to each of the different tools.
From here, the business teams are able to control exactly how that data field shows up in the tool of their choice. For example, let’s say the data engineer has defined a Lifetime Value (LTV) data property in Grouparoo. Now that LTV is defined in Grouparoo, the marketing team can map that to the Marketo Lead Fields so they can tailor their email campaigns. Customer support can map LTV to Zendesk User Fields so they can triage higher priority customer emails. Sales can map LTV to the Salesforce Account data fields so they can know the true value of their Accounts.
With a Reverse ETL pipeline in place to power your Operational Analytics, you can improve both your bottom-line revenue and top-line revenue. Your bottom-line revenue increases as you can free up engineering time and operations time supporting manual workflows. And your top-line revenue will increase as well as your growth teams will be able to execute and test campaigns more quickly and easily without being bottlenecked by out-of-date data.


Tagged in Engineering Data
See all of Andy Jih's posts.
Andy is the COO and co-founder of Grouparoo, an open source data framework that easily connects your data to business tools. Andy loves building products that help people.
Learn more about Andy @ https://www.linkedin.com/in/andyjih


Get Started with Grouparoo
Start syncing your data with Grouparoo Cloud
Start Free TrialOr download and try our open source Community edition.