The Grouparoo Blog
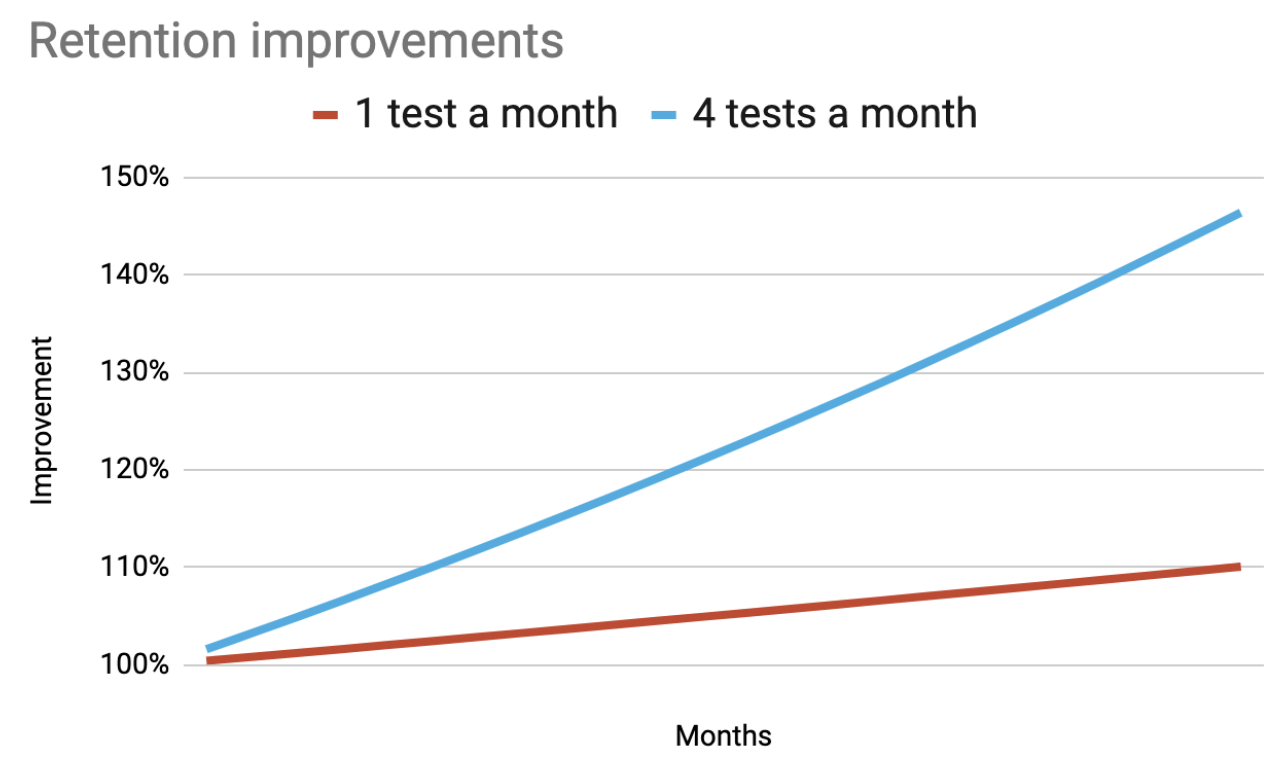
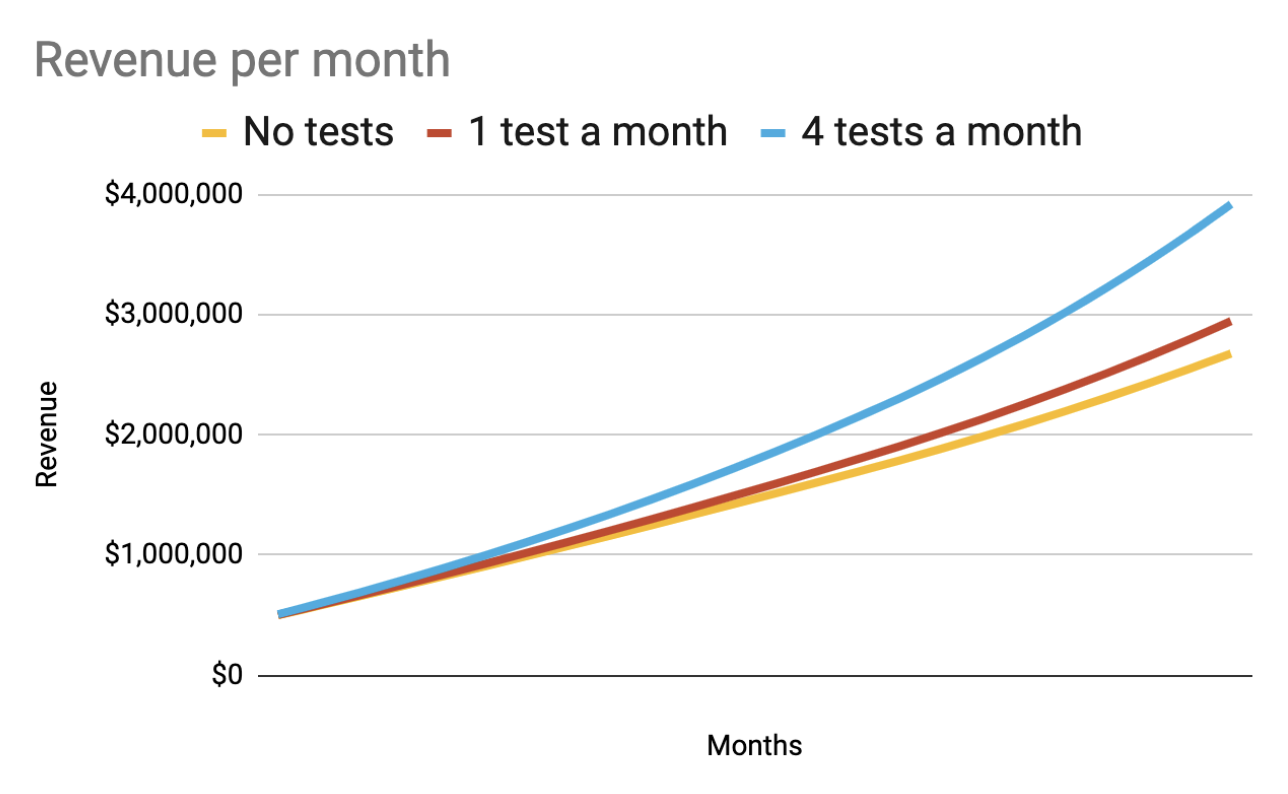
In the last post, I made a case that the way to make the biggest difference in a metric like retention is to increase how many tests you can run each month. It turns out, going from 1 to 4 tests a month makes a huge difference, especially as those cohorts build on each other over time.
To prove this out, I built a spreadsheet. Because I learned even more from creating the spreadsheet itself than writing the blog post, I thought I'd give those learnings some airtime, too. In particular, I figured out some cool formulas to simulate future cohorts from current data. I've shared the sheet here.
Cohorts
A cohort in this case is defined as everyone that made their first purchase in a given month. The retention rate of that cohort is the percentage that also makes a purchase the following month. The third month has its own retention rate. And so on. All of this adds up this fairly common triangular spreadsheet.
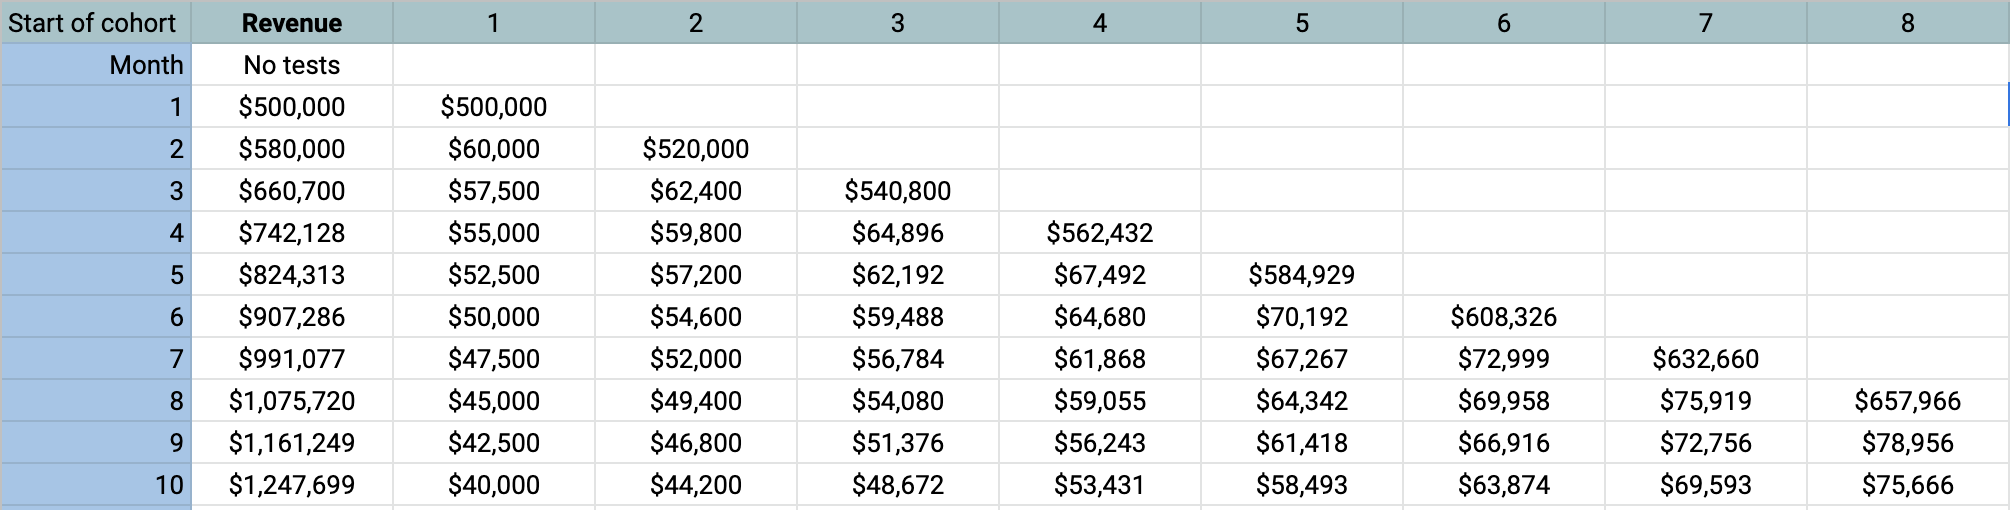
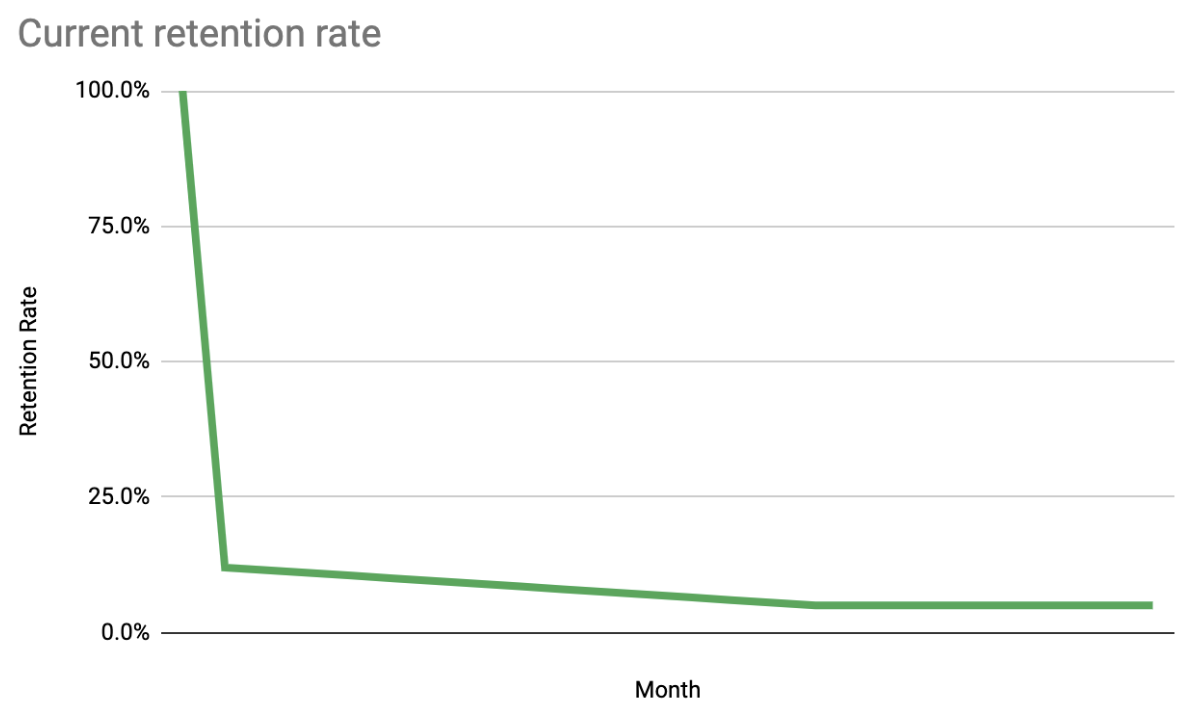
This one factors in a given user growth so each cohort is bigger than the last. It uses a model of the retention rate that can be entered in. These rates tend to drop quickly in the second month, slope down, and then level off.
Formulas
So now, what we have to do is generate these cohorts and their predicted behavior. One thing that has always bugged me was how fragile these things were. Because it is staggered by nature, I have always seen a lot of copy and paste. I wanted to be able to do that things where you drag it across the rows and columns and it is smart. What I learned about in the process was that you could have relative cell references. For example, "R[-1]C[-1]" means one row up and one column to the left. When combined with INDIRECT and IFS, you can do every cell the cohort graph in one glorious formula.
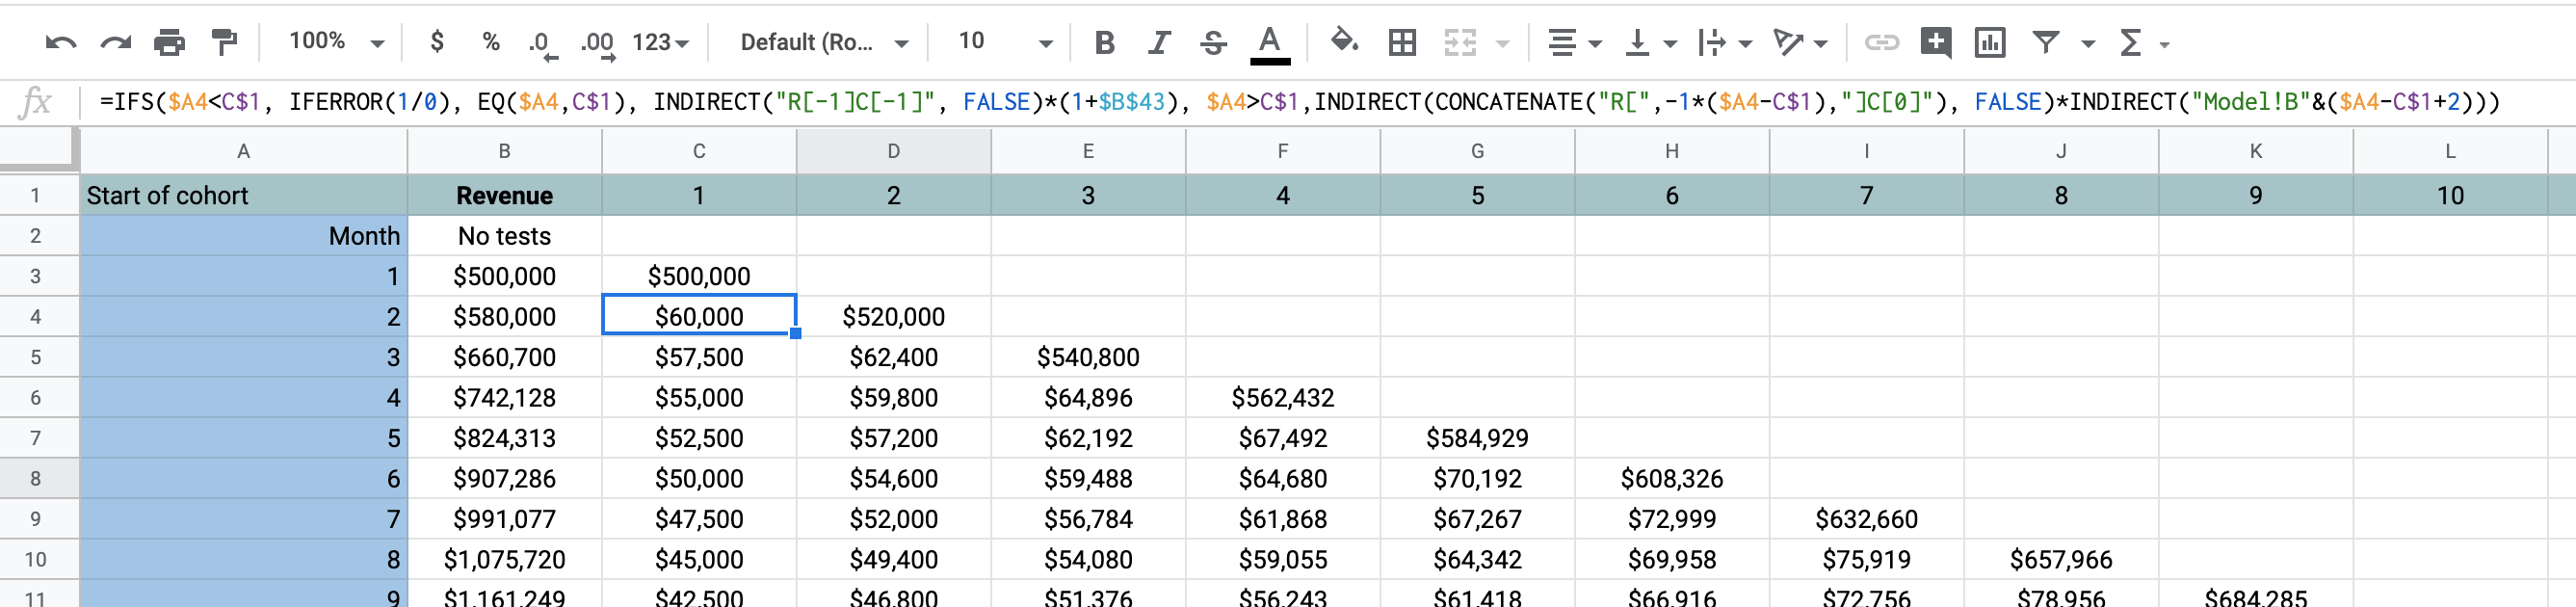
=IFS($A4<C$1, IFERROR(1/0), EQ($A4,C$1), INDIRECT("R[-1]C[-1]", FALSE)*(1+$B$43), $A4>C$1,INDIRECT(CONCATENATE("R[",-1*($A4-C$1),"]C[0]"), FALSE)*INDIRECT("Model!B"&($A4-C$1+2)))
So let's break that down:
| If... | Do this... | Explanation |
|---|---|---|
| $A4<C$1 | IFERROR(1/0) | This is way I found to be like an undefined cell. This should happen if the month we are on (row) is before the cohort month (column). That means we haven't acquired them yet! |
| EQ($A4,C$1) | INDIRECT("R[-1]C[-1]", FALSE)*(1+$B$43) | If the month and the cohort are the same, that means this is the month (row) we first see these users. So how much did we make from them? For that we look up and to the left ("R[-1]C[-1]"). We multiple this times the acquisition growth rate each month. |
| $A4>C$1 | INDIRECT(CONCATENATE("R[",-1*($A4-C$1),"]C[0]"), FALSE)*INDIRECT("Model!B"&($A4-C$1+2))) | Otherwise, it's after that and we need to see how it stacks up to the retention model. Because the model references the retention rate from the original month of their acquisition, we calculate how many that is relative to the month (row) we are on. Then, we can go up to the first month and get that number and multiply that time the corresponding month in the model. |
With that formula, I was able to be sure that there were no copy/paste errors because I could apply the same one to all the cells. Magic.
It was very satisfying to just drag it across and have the numbers pop up.
I was able to to a similar formula to understand how the number of tests you do a month impacts the gains you can get on a retention metric.
![=IFS($A4<C$1, IFERROR(1/0), EQ($A4,C$1), INDIRECT("R[0]C[-1]", FALSE), $A4>C$1,INDIRECT("R[-1]C[0]",FALSE)*$B$46)](https://www.grouparoo.com/posts/cohort-generation/formula-tests.png)
=IFS($A4<C$1, IFERROR(1/0), EQ($A4,C$1), INDIRECT("R[0]C[-1]", FALSE), $A4>C$1,INDIRECT("R[-1]C[0]",FALSE)*$B$46)
Results
The results are somewhat astounding. That, more tests really makes a huge difference. This is because of something akin to compound interest. Each month, more users are retained from month to month and their lifetime value accumulates.
Try it out
Do you want to estimate the return on investing in doing more tests with your own assumptions? Copy it and change the assumptions in the first slide and see what happens. Maybe you need some cohorts for something else? That's fine, too. It is available here. Have fun!


Tagged in Marketing
See all of Brian Leonard's posts.
Brian is the CEO and co-founder of Grouparoo, an open source data framework that easily connects your data to business tools. Brian is a leader and technologist who enjoys hanging out with his family, traveling, learning new things, and building software that makes people's lives easier.
Learn more about Brian @ https://www.linkedin.com/in/brianl429


Get Started with Grouparoo
Start syncing your data with Grouparoo Cloud
Start Free TrialOr download and try our open source Community edition.