The Grouparoo Blog
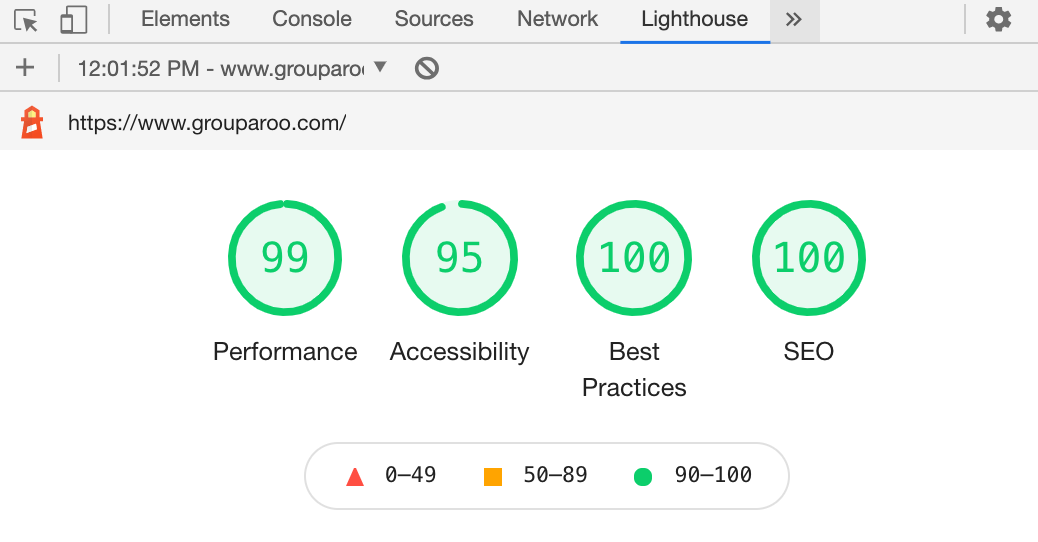
Performance is an important factor for user satisfaction, conversion and SEO. Lighthouse is a tool that creates a report on performance and other best practices. Most commonly, it used from the chrome extension.
However, you can also run this test locally. The @lhci/cli library, when installed, provides the following command line tool.
> next build
info  - Creating an optimized production build
info  - Compiled successfully
info  - Collecting page data
info  - Generating static pages (123/123)
info  - Finalizing page optimization
...

> lhci autorun
✅  .lighthouseci/ directory writable
✅  Configuration file found
✅  Chrome installation found
Healthcheck passed!

Started a web server with "PORT=54321 npm start"...
Running Lighthouse 1 time(s) on http://localhost:54321/about
Run #1...done.
...
Done running Lighthouse!

Uploading median LHR of http://localhost:54321/about...success!
Open the report at https://storage.googleapis.com/lighthouse-infrastructure.appspot.com/reports/1610848080418-24331.report.html
...

Done running autorun.
This will run for all the URLs that you tell it, launching a headless chrome browser one or more times for each to generate a report.
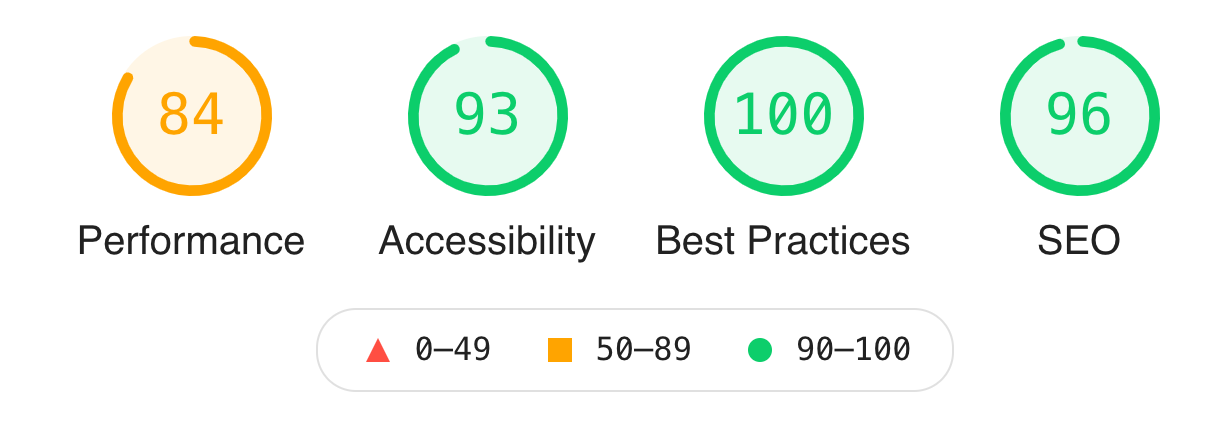
I have also noticed that the numbers (performance) on localhost are slower than on our production site. This is likely because the production site takes advantage of a CDN and other caching features. For example, the 84 score above on the /about page is a 96 on production. However, the local numbers correlate with the production ones.
Configuration
To make lhci autorun work how you want it, you'll need some configuration in the lighthouserc.js file. Ours exports this:
module.exports = {
  ci: {
    collect: {
      numberOfRuns: 1,
      url: urls,
      startServerCommand: "PORT=54321 npm start",
      settings: {
        onlyCategories: [
          "performance",
          "best-practices",
          "accessibility",
          "seo",
        ], // removes pwa (progressive web app)
        skipAudits: [
          "canonical", // never will be right on localhost
        ],
      },
    },
    upload: {
      target: "temporary-public-storage",
    },
  },
};
The most interesting thing about our implementation is that it reads the sitemap so that it automatically tests all the URLs that we give to search engines. As a related matter, we are also auto-generating our sitemap, so this means that every time we add a page, the new page will be performance tested.
I found that setting numberOfRuns more than 1 just took too long. Testing a URL more than once gives more accurate results, so the tradeoff was whether to really test every page or have less accurate results. I chose to test every page and haven't seen too much variance in the results so far.
Comment on the Pull Request
Testing and monitoring are great, but they have to be a part of the real workflow to make any difference. I decided to start with visibility. We can update this to fail a check and prevent a merge when there is a low score later.
To add this visibility, I set up Github to run an command on every pull request when there is a commit.
The command runs lchi autorun and then a script.
The script knows that lhci autorun puts performance reports as JSON in a certain place. It find those and generates a markdown table and writes that to disk.
Now, back in the Github action, it uses the markdown to make a comment that gets updated each time there is a commit.
The result is a comment on each pull request like this one:
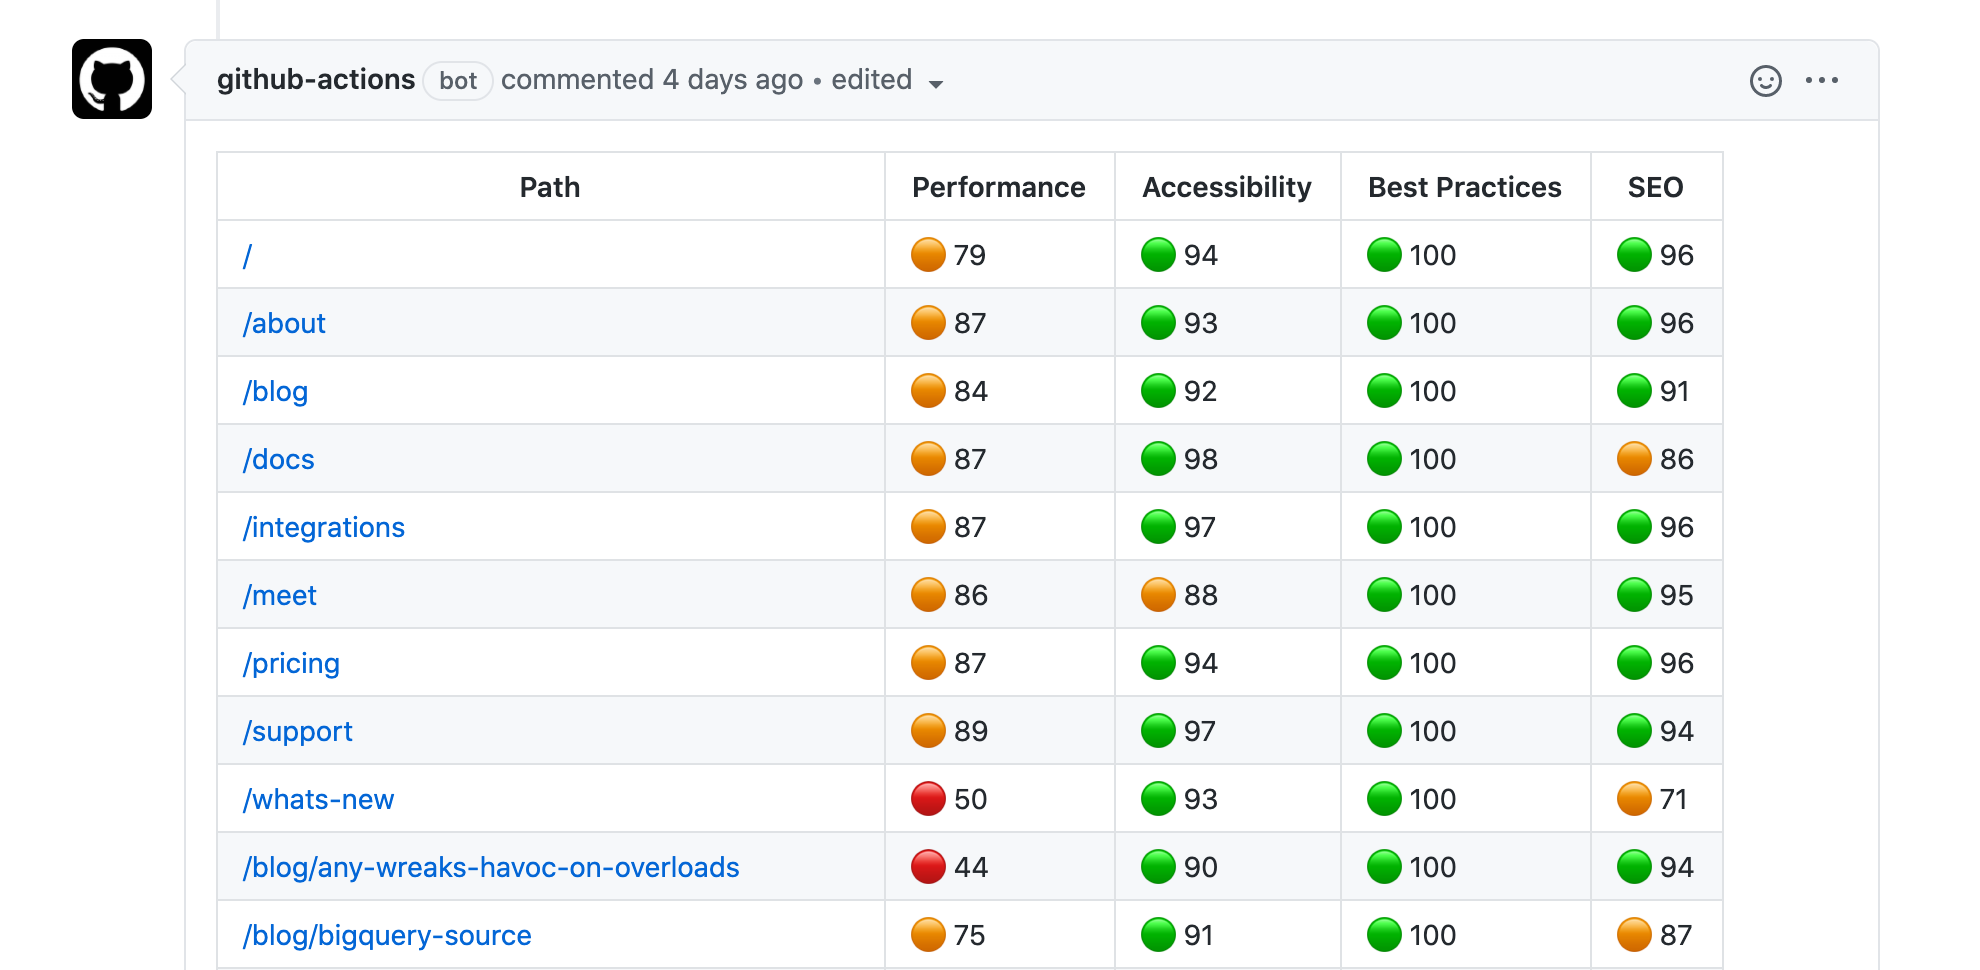
Each URL shows its Lighthouse overview and links to the real report. Success!
Meta!
Even the pull request for this blog post ran a check got a report. 💥


Tagged in Notes Engineering
See all of Brian Leonard's posts.
Brian is the CEO and co-founder of Grouparoo, an open source data framework that easily connects your data to business tools. Brian is a leader and technologist who enjoys hanging out with his family, traveling, learning new things, and building software that makes people's lives easier.
Learn more about Brian @ https://www.linkedin.com/in/brianl429


Get Started with Grouparoo
Start syncing your data with Grouparoo Cloud
Start Free TrialOr download and try our open source Community edition.